From Chris Kimble at Kimble Charting Solutions:
Hard to believe that Silver hit $50 an ounce in 2011? Even though silver is off to a good start in 2017 (up near 14%), it remains over 50% below the highs of six years ago.
Below looks at Silver on a monthly basis, over the past 40-years…
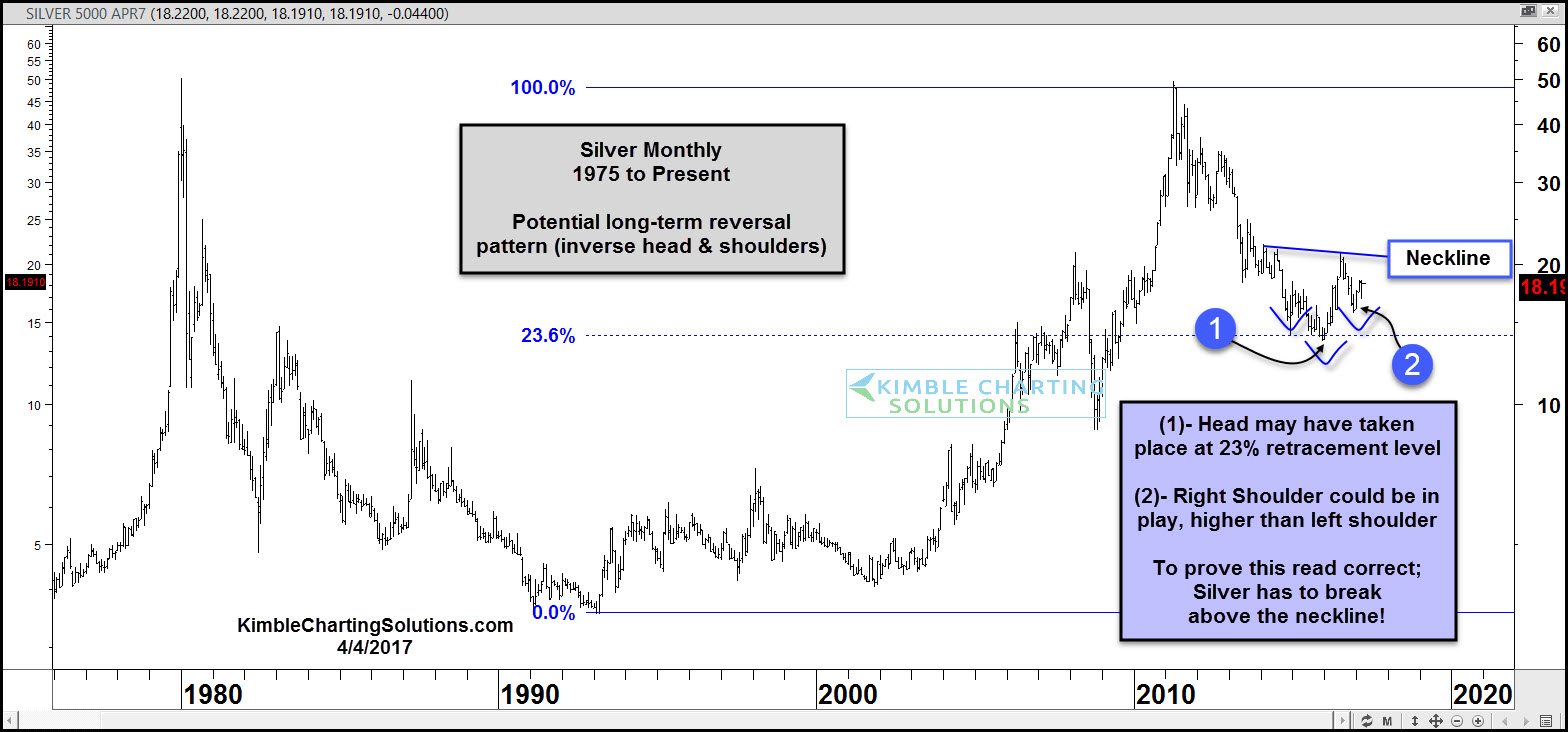
Silver hit the 1979 highs in 2011 (double-topped) and then proceed to create a series of lower highs and lower lows. The decline took silver down to its 23% retracement level of the 1993 lows/2011 highs. It is possible that silver created the “head” of a multi-year reversal pattern (inverse head & shoulders) at (1).
If silver is making a long-term bottoming pattern (inverse head & shoulders), the ideal price action would be; create a right shoulder above the left shoulder, where a rally takes off and breaks above the falling neckline, in the $20 zone. At this time the neckline comes into play as resistance. To prove the read correct, breaking above the neckline is a must!!!
Full Disclosure- Even though silver has done well in 2017, Premium and Metals members have been playing this sector via GDX & GDXJ. If this read for silver would happen to be correct, gold, silver and miners should do well.
 |
Tour the Great Wall This Summer With Dr. Steve Sjuggerud You'll tour the Great Wall and the Forbidden City... take a boat ride across Victoria Harbor... and learn about little-known investment opportunities in China and Hong Kong this summer, firsthand, with Dr. Steve Sjuggerud and leading investment experts. Learn more here. |
|---|